
Protein in Foods: The Complete Chart of 100+ Common Foods
Compare protein in foods with this USDA-sourced chart of 100+ common foods, showing grams of protein per 100 g and per typical U.S.
Protein in foods: the complete chart of 100+ common foods
Protein is in nearly every food, but the amount varies widely by food type, cooking method, and serving size. The 110+ entries below show protein per 100 g (for direct comparison) and protein per typical U.S. serving (for meal planning), all sourced from USDA FoodData Central. Jump to any category you need:
Contents
- How to use this protein chart
- Meat and poultry
- How much protein is in chicken breast?
- Fish and seafood
- How much protein is in 3 ounces of meat or fish?
- Dairy
- How much protein is in milk and Greek yogurt?
- Eggs
- Legumes and soy foods
- Grains and grain foods
- Nuts and seeds
- Vegetables
- Which food has the most protein per 100 grams?
- How much protein do adults need per day?
- Why protein per 100 grams differs from protein per serving
- Raw vs. cooked: why preparation state matters
- Animal protein vs. plant protein
- FAQ
How to use this protein chart
Every table uses two protein columns so you can both compare foods and plan meals. The "Protein / 100 g" column puts all foods on the same scale. The "Protein / Serving" column shows what you get on your plate.
Each row has six fields:
The math is simple: Protein per serving = Protein per 100 g × Serving weight (g) ÷ 100, as described in the USDA FoodData Central Foundation Foods Documentation.
All values are rounded to one decimal place. They come from USDA FoodData Central Foundation Foods, SR Legacy, or FNDDS records at USDA FoodData Central Food Search. Actual protein content can vary by cultivar, brand, cooking method, fat content, and moisture level.
Meat and poultry
Meat and poultry are among the most concentrated sources of dietary protein. A standard cooked serving is 3 oz (85 g), the size used by the Dietary Guidelines for Americans, 2025–2030.
Ham is a processed meat. A high protein number does not make processed meat a preferred protein food.
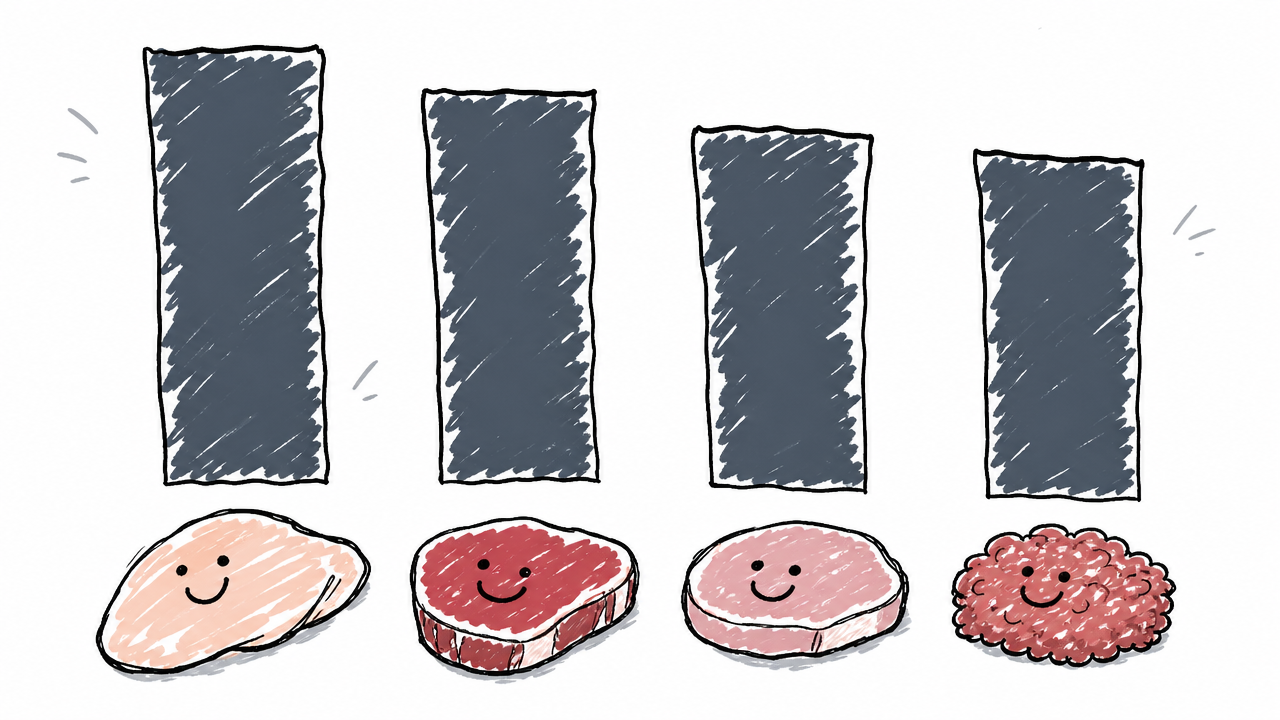
How much protein is in chicken breast?
A 3 oz (85 g) serving of cooked, skinless chicken breast provides about 26.4 g of protein, making it one of the leanest and most protein-dense common foods. Per 100 g cooked, skinless chicken breast contains about 31.0 g of protein.
Skin-on chicken breast has slightly less protein per 100 g (about 28–29 g) because the skin adds fat and moisture. For the highest protein density, choose skinless. Values from USDA FoodData Central.
Fish and seafood
Fish and shellfish deliver high-quality protein with generally less saturated fat than red meat. The standard serving is 3 oz (85 g) cooked; canned items are listed as drained.
How much protein is in 3 ounces of meat or fish?
Most lean meats and fish deliver 20–28 g of protein per 3 oz (85 g) cooked serving. The exact amount depends on the species, cut, fat content, and cooking method.
See the full Meat and Poultry and Fish and Seafood tables above for details.
Dairy
Dairy products range from moderate to high in protein. Greek yogurt, cottage cheese, and hard cheeses top the list. Liquid dairy servings are 1 cup (240 mL); hard cheeses use 1 oz (28 g); ricotta uses ½ cup.
Dairy alternatives such as soy milk are listed in the Legumes and Soy Foods section below.
How much protein is in milk and Greek yogurt?
One cup (244 mL) of whole milk contains about 8.0 g of protein. One cup (245 g) of plain Greek yogurt provides roughly 15–21 g, depending on the brand, fat content, and straining process. Greek yogurt can contain two to three times the protein of regular yogurt because straining removes whey liquid. Values from USDA FoodData Central.
Eggs
Eggs are a complete-protein food, meaning they supply all essential amino acids in adequate amounts. The standard serving is 1 large egg (~50 g).
How much protein is in one egg?
One large egg contains about 6.3 g of protein. The white provides about 3.6 g and the yolk about 2.7 g. Hard-boiling does not change the total protein much; it simply removes a small amount of water, keeping the per-egg value the same.
Legumes and soy foods
Beans, lentils, peas, and soy foods are the highest-protein plant foods. USDA MyPlate counts them in both the Vegetable group and the Protein Foods group, as noted by Nutrition.gov. Standard bean and lentil servings are ½ cup cooked; tofu and tempeh use 3 oz (85 g); hummus uses 2 tbsp, per MedlinePlus serving guidance.
Canned beans are listed as heated and drained unless otherwise noted.
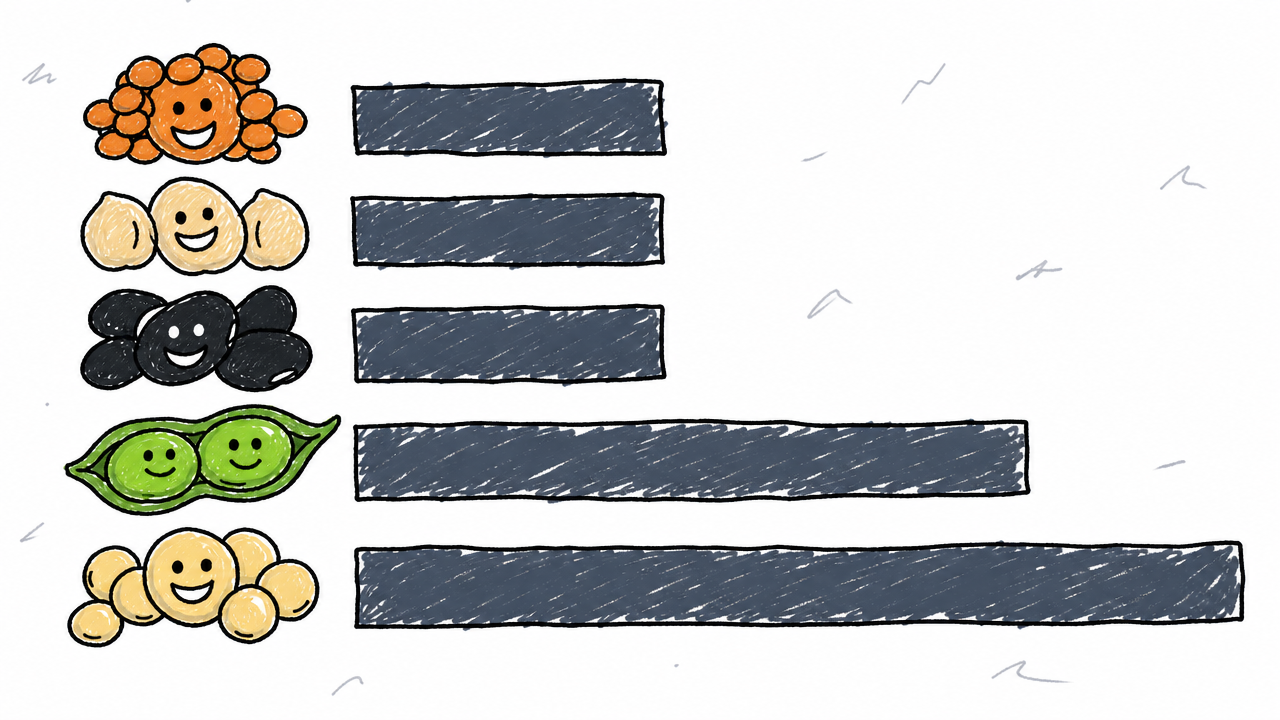
Are beans, lentils, and chickpeas good sources of protein?
Yes. A ½-cup cooked serving of most beans, lentils, or chickpeas provides 7–10 g of protein, on par with 1 oz of cooked meat. They also supply dietary fiber, folate, iron, and potassium, making them nutrient-dense choices for both the Protein Foods group and the Vegetable group.
Grains and grain foods
Grains are not usually called high-protein foods, but they add real protein across a full day's diet. Dry and cooked values differ sharply because of water intake during cooking, so every row clearly labels its state. Quinoa is notable as a complete plant protein, containing all essential amino acids (Harvard Health).
Nuts and seeds
Nuts and seeds are calorie-dense and deliver protein along with healthy fats, fiber, and minerals. The standard serving is 1 oz (28 g) for whole nuts and seeds; peanut butter uses 2 tbsp (~32 g), per MedlinePlus.
Vegetables
Vegetables are not primary protein sources, but some contribute notable amounts, especially in generous servings. Including them here lets you build an accurate daily protein tally. Servings are 1 cup cooked or raw (varies by vegetable) or 1 medium potato.
Which vegetables contain the most protein?
Among common vegetables, cooked edamame and green peas lead (counted in the Legumes section above). In the standard vegetable category, Brussels sprouts, spinach, corn, asparagus, and kale each provide roughly 3.8–5.3 g per cooked cup. Those numbers are modest next to meat or legumes, but they add up across several servings in a day.
Which food has the most protein per 100 grams?
Among common whole foods, Parmesan cheese (~35.8 g), lean chicken breast (~31.0 g cooked), and pumpkin seeds (~29.8 g) rank near the top per 100 g. Dried, concentrated, or heavily processed foods (beef jerky, dried fish, protein powders) can score even higher, but people eat them in much smaller amounts.
Mixing dried foods with cooked foods in one ranking is misleading. A 100-g comparison works best within the same category and cooking state, not across categories with very different moisture levels and typical servings. Always check the "Protein / Serving" column to see what a realistic intake looks like.
How much protein do adults need per day?
The answer depends on which guideline you follow. The Dietary Guidelines for Americans, 2025–2030 set a protein goal of 1.2–1.6 g per kilogram of body weight per day (DGA, 2025–2030; dietaryguidelines.gov). Separately, the long-standing Recommended Dietary Allowance (RDA) from the National Academies of Sciences, Engineering, and Medicine is 0.8 g per kilogram of body weight per day. These are not the same: the DGA target reflects updated evidence on optimal intake, while the RDA represents the baseline to meet basic needs for most healthy adults.
Practical example for a 70 kg (154 lb) adult:
Protein needs vary with age, body size, pregnancy, lactation, physical activity, and health status. The USDA DRI Calculator for Healthcare Professionals provides individualized estimates.
Readers with kidney disease, pregnancy-related concerns, or other medical conditions should consult a qualified health professional before adjusting protein intake.
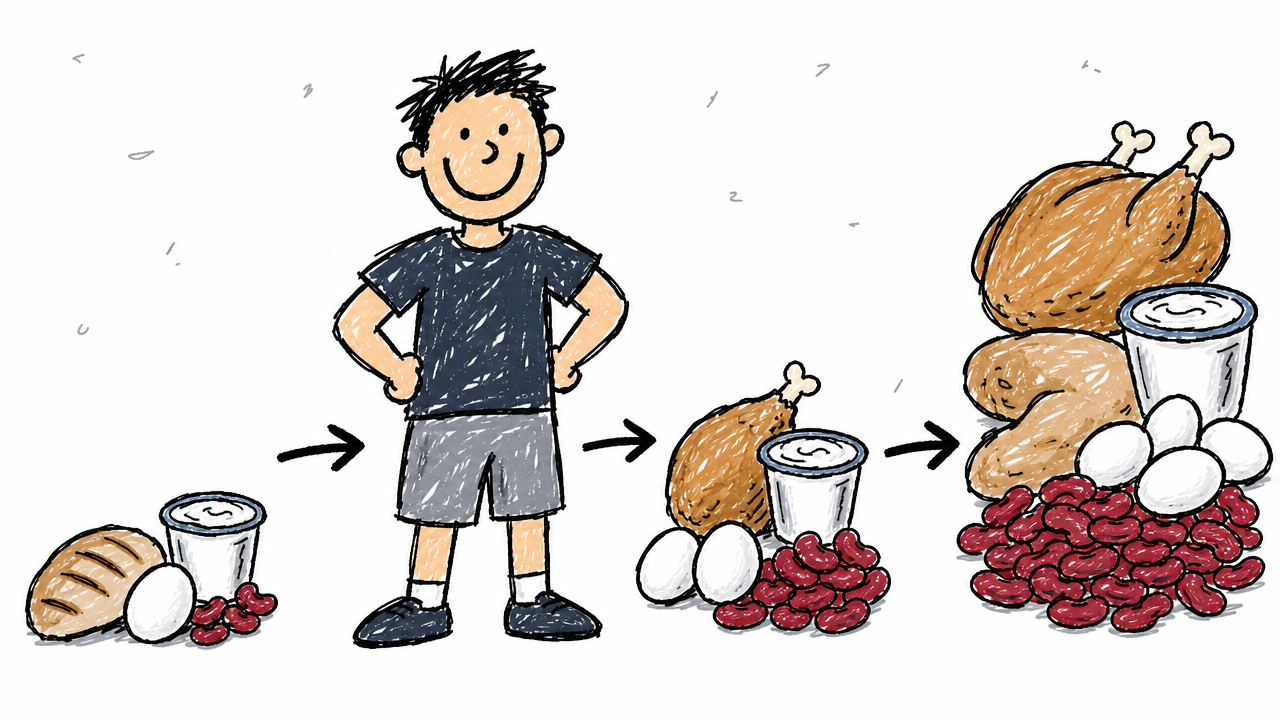
Why protein per 100 grams differs from protein per serving
The 100-gram figure is a standard comparison unit, not a serving size. A serving reflects how much people eat, and that amount varies widely between foods.
Take Parmesan cheese: it contains ~35.8 g of protein per 100 g, but a typical serving is 1 tablespoon (~5 g), yielding only ~1.8 g of protein. Cottage cheese, on the other hand, has a lower protein density per 100 g (~11.8 g) but a 1-cup serving weighs 226 g, delivering ~26.7 g of protein.
The tables in this article show both numbers in every row so you can compare foods on equal footing and plan meals based on real servings.
Raw vs. cooked: why preparation state matters
Cooking drives off moisture, which concentrates nutrients per gram of cooked weight. A 100-g raw chicken breast is not the same as 100 g of cooked chicken breast: the cooked version has lost water and holds more protein per gram.
Every row in the tables above labels its form and state. Do not compare a raw 100-g value from one chart with a cooked 100-g value from another; the numbers are not interchangeable.
USDA protein values are figured from total nitrogen using recommended nitrogen-to-protein conversion factors, as detailed in the Foundation Foods Documentation. Different USDA data types (Foundation Foods, SR Legacy, and FNDDS) also vary in analytical detail and update frequency (USDA FoodData Central Data Documentation), which is another reason values can differ slightly between sources citing USDA data.
Animal protein vs. plant protein
Animal sources (meat, fish, eggs, dairy) are complete proteins: they contain all essential amino acids in the amounts humans need. Most plant sources are lower in one or more essential amino acids, but soy, quinoa, and hemp seeds are notable exceptions that qualify as complete proteins (Harvard Health).
In practice, total variety matters more than the complete-vs.-incomplete label. Eating a range of grains, legumes, nuts, seeds, and vegetables over the course of a day provides all essential amino acids without careful meal-by-meal combining.
Do vegetarians and vegans need to combine proteins at every meal?
No. The idea of "protein combining" at each meal is outdated. Current nutrition science holds that eating a variety of plant-protein sources throughout the day meets amino acid needs. You do not need to pair rice with beans at the same sitting, for example, as long as your daily diet includes diverse protein sources.
FAQ
What counts as a serving from the Protein Foods group?
One ounce-equivalent equals: 1 oz cooked meat, poultry, or fish; 1 egg; ¼ cup cooked beans or peas; 1 tbsp peanut butter; or ½ oz nuts or seeds. These come from USDA MyPlate, as summarized by Nutrition.gov.
How is protein per serving calculated from USDA FoodData Central data?
Protein per serving = Protein per 100 g × Serving weight in grams ÷ 100. For example, if chicken breast has 31.0 g protein per 100 g and the serving is 85 g, the result is 31.0 × 85 ÷ 100 = 26.4 g. The formula is documented in the USDA Foundation Foods Documentation.
Which plant foods are highest in protein?
Tempeh (~16.9 g per 3 oz), cooked soybeans (~14.3 g per ½ cup), firm tofu (~14.7 g per 3 oz), lentils (~8.9 g per ½ cup), and black beans (~7.6 g per ½ cup) lead among common plant foods.
Do grains such as oats, rice, pasta, and quinoa contain protein?
Yes. Cooked quinoa provides about 8.1 g per cup; cooked regular pasta about 8.1 g per cup; oatmeal about 5.6 g per cup cooked. They are extra rather than primary protein sources, but their totals add up across meals.
Is the protein amount different in raw and cooked foods?
Yes. Cooking removes moisture, so protein per 100 g of cooked food is typically higher than per 100 g of the same food raw. Always check whether a listed value refers to the raw or cooked form before using it for meal planning.