
E-commerce Return Statistics: Return Rates by Category and What They Cost
Explore the latest ecommerce return statistics, from the 19.3% online return rate to category breakdowns, processing costs, fraud figures, and how return polici
E-commerce return statistics: return rates by category and what they cost
The most recent broad U.S. benchmark from the National Retail Federation (NRF) estimated that 19.3% of online sales were returned in 2025, compared with a 15.8% all-retail return rate representing $849.9 billion in returned merchandise. The all-retail figure includes lower-returning in-store purchases and should not be used as the e-commerce benchmark. Exact figures vary by source, product category, and whether BORIS (buy online, return in store) returns are included. Every statistic below is sourced to its primary report or press release and grouped by theme.
Key e-commerce return statistics at a glance
These headline numbers frame the sections that follow. Each links to its primary source and is explored in detail later in the article.
Overall e-commerce return rates: online vs. in-store
Online purchases are returned at roughly two to three times the rate of in-store purchases, depending on the source. The gap exists because online shoppers cannot touch, try on, or inspect merchandise before buying, which makes fit uncertainty, color discrepancies, and unmet expectations far more common. Below are the primary benchmarks.
What is the average e-commerce return rate?
The broadest current online benchmark is about one in five sales returned. Here are the key data points and how they compare year over year.
19.3% of online sales were estimated to be returned in 2025, based on a survey of 358 e-commerce professionals at large U.S. merchants. Takeaway: This is the most useful current broad benchmark for online return rates. Source: NRF 2025 Retail Returns Landscape and NRF 2025 press release.
15.8% of total annual retail sales were estimated to be returned in 2025, representing $849.9 billion. Takeaway: The all-retail rate is lower because it includes lower-returning store purchases. Source: NRF 2025 press release.
The comparable 2024 all-retail estimate was 16.9%, or $890 billion. Takeaway: The 2025 estimate was lower than 2024, but both are estimates rather than a complete census. Source: NRF 2024 press release.
In 2023, online sales had a 17.6% return rate ($247 billion); pure brick-and-mortar returns were 10.02% ($371 billion). NRF noted that its approach changed and that these figures should not be compared with earlier reports. Takeaway: Online returns were materially higher than pure store returns even before accounting for measurement differences. Source: NRF 2023 Consumer Returns in the Retail Industry.
How do Appriss and ICSC figures compare?
Different organizations report different online return rates because they use different data sources and definitions. The table below shows why a single "average return rate" can be misleading.
Appriss Retail and Deloitte estimated a 24.52% return rate for online sales in 2024, versus 8.72% for in-store sales. The online figure includes both BORIS and BORO returns. Q1–Q3 data came from the U.S. Census Bureau; Q4 was projected from Q4 2023 actuals. Takeaway: This source reports a much wider online/in-store gap than NRF because the datasets and definitions differ. Source: Appriss Retail / Deloitte 2024 report.
Appriss also estimated $362.16 billion in returns from online sales, $323.73 billion from in-store sales, and $685.86 billion in total retail returns in 2024. Takeaway: Online purchases accounted for more than half the return dollars despite representing a smaller share of total retail sales. Source: Appriss 2024 report.
ICSC found an average 15.2% return rate for online transactions versus 5% for in-store transactions in its analysis of 2022 spending across 69 retailers and 2,103 stores. Takeaway: Independent retailer transaction analysis also found online returns roughly three times higher than in-store returns. Source: ICSC analysis.
What are BORIS and BORO returns?
BORIS (buy online, return in store) and BORO (buy online, return online) describe the two channels through which an online order can be returned. Whether a dataset includes both, one, or neither materially changes the reported online return rate.
Within Appriss' 24.52% online return-rate estimate, BORIS represented a 14.58% rate ($215.35 billion) and BORO represented a 9.94% rate ($146.81 billion). Source: Appriss 2024 report.
Takeaway: BORIS returns are the larger share of online returns by dollar value, and their inclusion or exclusion is the single biggest reason published online return rates differ.
For reverse-logistics planning, the distinction matters because BORIS returns are processed at store level (requiring floor labor, storage space, and store-to-warehouse transfers), while BORO returns flow through mail and carrier networks (requiring prepaid labels, carrier pickup density, and centralized inspection facilities).
Return rates by product category
Apparel and footwear consistently show the highest return rates of any major e-commerce category. No single authoritative U.S. dataset provides a directly comparable current return rate for every product category. The figures below are labeled by measure type so that order-return rates, consumer-incidence survey data, and merchant benchmarks are not confused.
Are apparel and clothing the most returned online products?
Yes. Apparel leads every major dataset, driven primarily by fit and sizing uncertainty.
Coresight Research estimated a 24.4% average return rate for U.S. online apparel orders for the 12 months ending March 2023. Takeaway: Apparel is consistently a high-return category, with fit and sizing as the leading operational issue. Source: Coresight Research.
ICSC found that apparel retailers had a 22% online product return rate versus 6.2% for in-store purchases. Takeaway: Apparel shows the online/in-store gap especially well because customers commonly order several sizes or styles to try at home. Source: ICSC analysis.
ICSC reported that 87% of consumers who overbuy online do so with apparel to try products at home and return what they do not want. Takeaway: Bracketing is a central explanation for apparel's higher return rate, though it is not automatically classified as fraud. Source: ICSC analysis.
Coresight found that size/fit was cited by 53% of surveyed apparel decision-makers as a leading reason for online apparel returns; color was cited by 16% and damage by 10%. Takeaway: Product fit information and sizing consistency are more actionable apparel-return levers than a blanket policy change. Source: Coresight Research.
Coresight also estimated $38 billion in returned online apparel and footwear merchandise in 2023 and $25.1 billion in associated processing costs. Takeaway: Apparel returns can consume a large share of category economics even before lost margin and markdowns are counted. Source: Coresight Research.
Category return incidence from consumer surveys
Statista Consumer Insights reported clothing as the category most often returned by U.S. online shoppers: 25% for clothing, 17% for shoes, and 12% for accessories. Source: Statista chart.
⚠ Measurement warning: These figures represent the share of surveyed consumers who returned an item in the category during the prior 12 months (with responses possible in more than one category). They are not order-return rates and should not be equated with Coresight or ICSC figures.
Takeaway: Clothing leads category return incidence because shoppers cannot assess fit, appearance, or feel before buying.
Merchant-level category benchmarks
Loop Returns analyzed more than 22 million returns from over 4,000 Shopify merchants across ten verticals from January 1 to October 31, 2024. Source: Loop Winter 2024 Benchmark Report.
Swimwear was the highest-return vertical in the Loop dataset at 21.6%. Home goods had the highest handling fees at 17%. Takeaway: Fit-sensitive subcategories such as swimwear can outperform broader apparel averages in return intensity, and a lower return rate does not necessarily mean lower return cost. Source: Loop Winter 2024 Benchmark Report.
Caveat: Loop data represents participating Shopify brands, not the full U.S. market.
How much do e-commerce returns cost retailers?
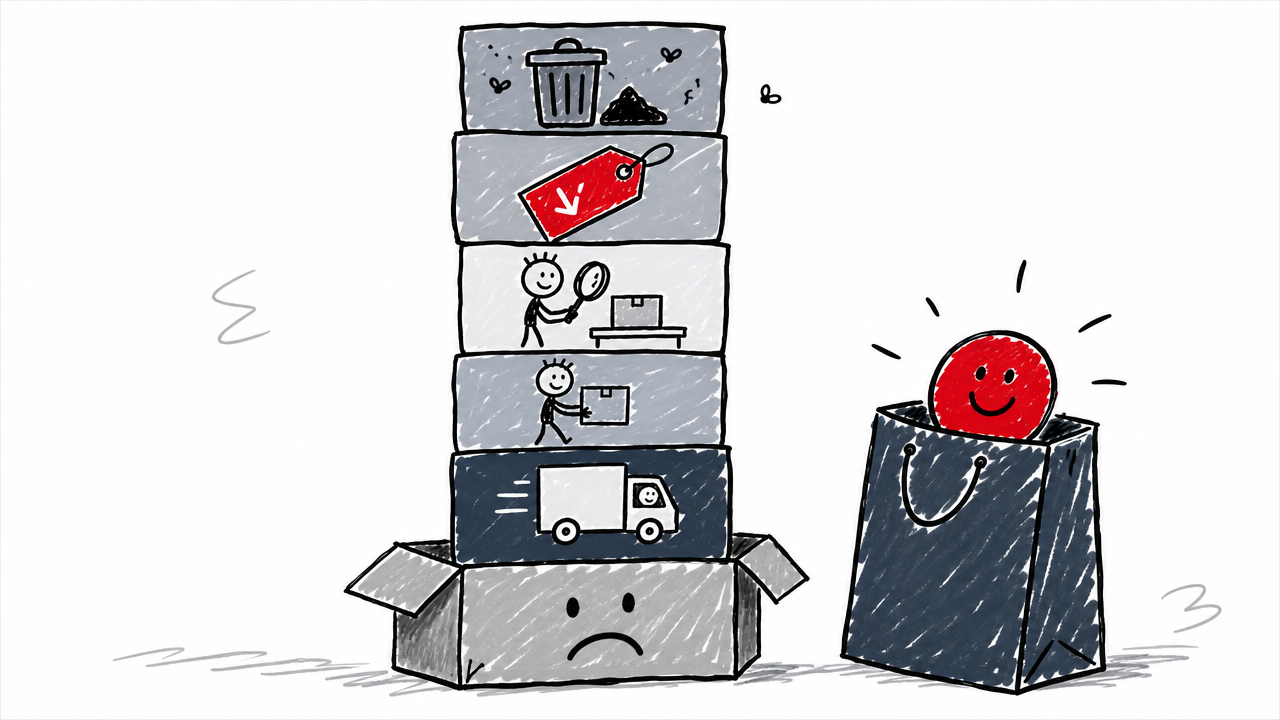
Returns cost far more than the refund amount alone. Optoro estimated that processing a return costs retailers an average of $26.50 for every $100 in returned merchandise, or roughly 30% of the original item price. The remaining value is eroded by shipping, labor, inspection, markdowns, and resale losses. No single universal dollar-per-parcel figure exists; the sources express cost as a share of returned value.
Optoro: processing costs average 30% of the original item price. Takeaway: A return can erase much of the margin on an otherwise successful sale, especially when the item cannot be resold at full price. Source: Optoro 2024 report.
Optoro: the average extra consumer return fee was just under $7. Takeaway: Return fees recover only part of the underlying cost and may introduce conversion and loyalty risk. Source: Optoro 2024 report.
Optoro: 37% of shoppers said paying return shipping was the most frustrating part of making a return. Takeaway: Shipping fees are both a cost-recovery tool and a source of customer friction. Source: Optoro 2024 report.
Coresight estimated $25.1 billion in processing costs for online apparel and footwear returns in 2023. Takeaway: Category-level processing costs can be more useful than an all-retail average for operations planning. Source: Coresight Research.
Blue Yonder found that 63% of 210 surveyed U.S. online retailers said returns were a significant business issue; 59% reported rising return rates in the previous 12 months. Takeaway: The majority of surveyed retailers view returns as a growing operational and financial challenge. Source: Blue Yonder E-Commerce Returns 2024.
What makes up the cost of a return?
The total cost of processing a return typically includes some or all of these components:
- Outbound and return shipping (carrier fees for getting the item back)
- Carrier surcharges (dimensional weight, peak-season fees)
- Customer service labor (initiating the return, handling inquiries)
- Refund transaction fees (payment-processor costs on the refunded amount)
- Inspection and grading (determining whether the item is resalable)
- Repackaging (preparing the item for restocking or liquidation)
- Restocking (returning inventory to saleable status in the warehouse)
- Inventory holding time (cost of capital while the item is in transit or processing)
- Markdown or liquidation losses (selling below original price)
- Lost selling time (missed demand during the return cycle)
- Fraudulent claims (refunds issued for items never returned)
- Disposal or donation costs (items that cannot be resold at any price)
Takeaway: No single universal dollar-per-parcel cost exists. Retailers should model return cost as a share of returned value and track each component separately to find the largest cost levers.
Holiday return statistics
Holiday merchandise creates a predictable post-season reverse-logistics surge. Planning for it requires labor, carrier, and policy decisions well before the returns peak arrives.
NRF 2025: retailers expected 17% of holiday sales to be returned in the 2025 holiday season. Source: NRF 2025 press release.
NRF 2024: retailers expected their return rate to be 17% higher than their annual return rate during the 2024 winter holidays. Source: NRF 2024 press release.
These are two different measurements. "17% of holiday sales" is a rate applied to holiday revenue. "17% higher than the annual rate" is a relative increase above baseline. Do not treat them as the same figure.
NRF 2025: planned holiday responses included increased 3PL reliance (49%), seasonal returns staff (43%), and extended return windows (37%). Source: NRF 2025 press release.
NRF 2024: comparable figures were 3PL support (40%) and seasonal returns staff (34%), suggesting greater planned operational investment in 2025 than 2024. Source: NRF 2024 press release.
Loop identified December 26 as the top return day, with 143,726 returns in its merchant dataset. Takeaway: The first days after Christmas create an acute processing spike even when annual return rates appear stable. Source: Loop post-holiday analysis.
Return fraud and abuse statistics
Return fraud and abuse represent a separate loss layer beyond ordinary reverse-logistics costs. Retailers face a widening range of schemes, from wardrobing and bracketing to empty-box fraud and counterfeit-item substitution. AI-based detection is now widespread among large merchants, but no single control addresses every risk pattern.
What percentage of returns are fraudulent?
NRF found that 9% of all returns were fraudulent in its 2025 survey. Takeaway: Nearly one in ten returns in the surveyed merchant sample was linked to fraud, making verification an operational priority. Source: NRF 2025 press release.
Appriss Retail and Deloitte estimated $103 billion in fraudulent and abusive returns and claims in 2024, representing 15.14% of total returns in their dataset. Source: Appriss 2024 report.
These figures are not directly interchangeable. NRF's 9% is a narrower measure of fraudulent returns. Appriss' 15.14% combines fraud, abuse, and claims (including appeasements for missing or damaged goods). Appriss separately estimated $21 billion in claims and appeasement fraud and abuse in 2024. Source: Appriss 2024 report.
What are bracketing and wardrobing?
Bracketing is ordering several sizes, colors, or styles with the intent to keep one and return the rest. It is common in apparel and is not automatically classified as fraud.
Wardrobing is wearing or using an item and then returning it as if unused.
NRF found that 45% of consumers considered it acceptable to "bend the rules" when returning items. Source: NRF 2025 press release.
Nearly two-thirds of consumers admitted to at least one costly return behavior, including wardrobing, bracketing, sending different items, or sending empty boxes. Takeaway: Not every costly return behavior is fraud, but all of them increase handling and inventory costs. Source: NRF 2025 press release.
Rising fraud tactics
Among retailers tracking incidents, NRF reported:
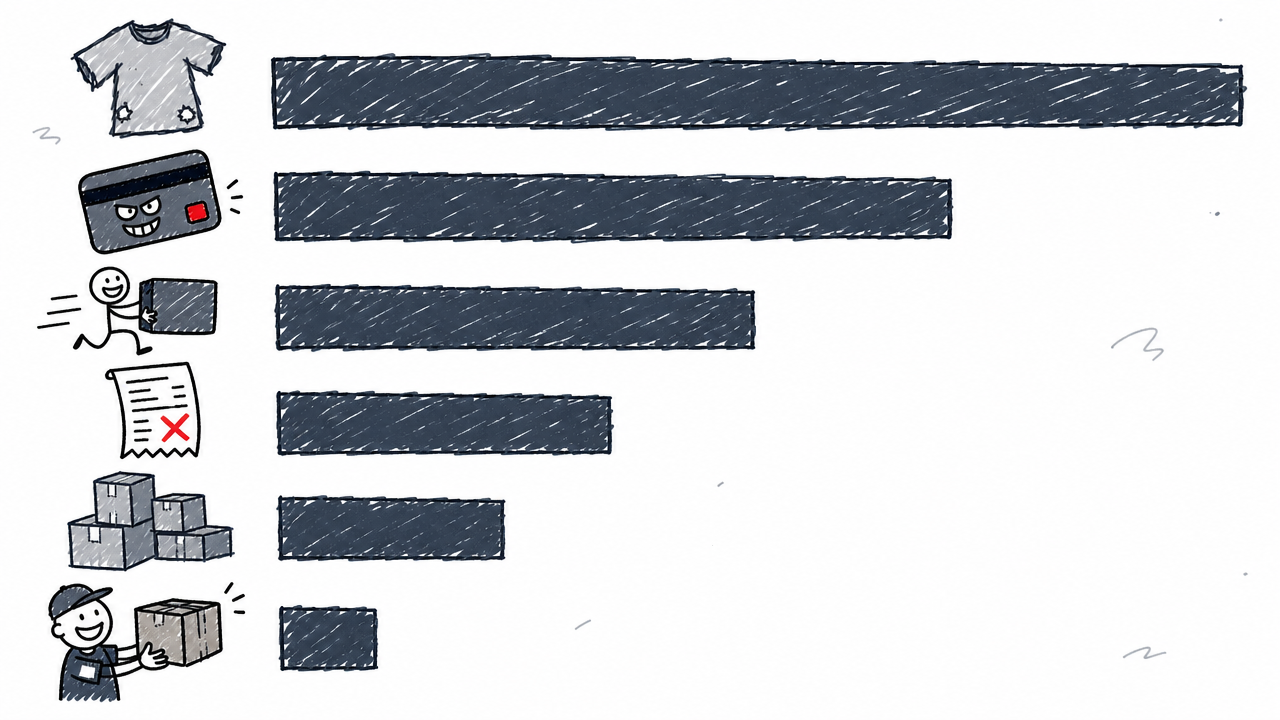
- 71% saw increases in overstated return quantities
- 65% saw increases in empty-box or "box of rocks" returns
- 64% saw increases in decoy returns (counterfeit items substituted)
Source: NRF 2025 press release.
Appriss found that among surveyed retail executives:
- 60% encountered wardrobing
- 55% encountered fraudulent or stolen tender
- 48% encountered returned stolen merchandise
- 48% encountered counterfeit receipts
- 47% encountered bracketing
- 39% encountered employee return fraud or collusion
Source: Appriss 2024 report.
NRF reported that 85% of merchants were using artificial intelligence to detect or prevent return fraud. Takeaway: AI adoption is widespread among surveyed large merchants, but NRF describes it as partial relief rather than a complete solution. A single blanket return restriction will not address every risk. Source: NRF 2025 press release.
How return policies affect conversion and customer loyalty
Free and convenient return policies reduce perceived buying risk and can lift both conversion and repeat orders. The optimal policy depends on category, margin, fraud exposure, and customer segment. Restricting returns may lower reverse-logistics cost while also increasing cart abandonment and reducing customer lifetime value.
NRF 2025: 82% of consumers said free returns were important when shopping online. Takeaway: Free returns remain a buying-decision factor, even as retailers try to cut their cost. Source: NRF 2025 press release.
NRF 2025: 76% were more likely to choose an option offering an instant refund or exchange. Takeaway: Refund speed and exchange convenience are part of the conversion and retention experience. Source: NRF 2025 press release.
NRF 2025: 71% were less likely to shop with a retailer again after a poor returns experience. Takeaway: Cutting return cost at the expense of customer experience can create downstream retention losses. Source: NRF 2025 press release.
NRF 2024: 76% considered free returns a key shopping factor; 67% said a negative experience would discourage future shopping; 84% were more likely to shop with a retailer offering no-box/no-label returns and immediate refunds. Source: NRF 2024 press release.
ICSC: 71% would likely stop shopping online with a company that charged return shipping fees; 60% would stop if the free-return window were shortened. Takeaway: Return-fee and return-window changes can reduce return exposure while also creating significant customer-acquisition risk. Source: ICSC analysis.
A meta-analysis of 21 studies found that lenient return policies increased purchases more than returns overall. Takeaway: The commercial question is not whether a policy reduces returns, but whether it creates enough added purchases to offset the cost. Source: Janakiraman et al., Journal of Retailing, 2016.
How to interpret an e-commerce return-rate benchmark
Published return rates vary widely because they measure different things. A retailer comparing its own performance to an industry benchmark should first make sure the denominator matches.
How should a retailer calculate its return rate?
The most common formula is return rate by sales value:
Return rate by sales value =
  value of returned merchandise ÷ total merchandise sales × 100
Other metrics worth tracking alongside the headline rate:
- Return rate by order (returned orders ÷ total orders)
- Return rate by unit (returned units ÷ total units shipped)
- Refund rate (share resulting in a monetary refund vs. exchange or store credit)
- Exchange rate (share resulting in an exchange)
- Retained revenue (sales value kept after exchanges and credits)
- Cost per return (total reverse-logistics cost ÷ number of returns)
- Return-to-stock time (days from return initiation to resalable inventory)
- Resale or liquidation rate (share of returned inventory sold at full price vs. marked down, liquidated, or disposed)
Why do published return rates differ so much?
Each major source uses a different data collection approach:
Warning: Combining figures from these sources into a single trend line without noting the differences will produce a misleading picture.
Source notes
All figures in this article are sourced to primary reports or press releases. Publication dates and survey periods are noted inline.
- NRF 2025 and 2024 figures are estimates or projections, not completed-year census results.
- Appriss' Q4 data was projected from prior-year actuals, introducing an estimation component.
- No 2026 NRF annual return report was verified before this article's publication date. Do not treat the 2025 estimates cited here as current-year data.
- Figures from different sources use different denominators (sales value, order count, consumer incidence) and should not be directly compared without qualification.
- Where a statistic is described as an "estimate" or "projection," that label reflects the source's own characterization.
FAQ
What is a good e-commerce return rate?
No universal "good" rate exists. NRF's 19.3% online benchmark is a broad median; apparel merchants typically see higher rates, while beauty or consumables see lower. Compare against your own category and return-channel mix (BORIS vs. BORO) rather than relying on a single cross-industry number.
What is the difference between a return rate and a refund rate?
Return rate measures the share of sales, orders, or units sent back. Refund rate measures the share that resulted in a monetary refund rather than an exchange or store credit. A retailer with a high return rate but strong exchange conversion may keep more revenue than the return rate alone suggests.
Do free returns increase conversion?
Surveys and a meta-analysis of 21 studies suggest lenient return policies increase purchases more than they increase returns. The net effect depends on category, margin structure, and fraud exposure. Free returns are not universally optimal.
What is bracketing in e-commerce?
Ordering several sizes, colors, or styles with the intent to keep one and return the rest. It is especially common in apparel (87% of consumers who overbuy online do so with apparel) and is not automatically classified as fraud, though it increases processing volume and cost.
When do most holiday returns happen?
Loop merchant data identified December 26 as the peak return day, with 143,726 returns recorded in its dataset. The post-Christmas week through early January typically generates the largest seasonal reverse-logistics volume, and NRF data shows retailers increasingly plan for it with added 3PL capacity and seasonal staff.